No graph, no meeting! Part 5
This is without doubt my absolute favourite chart. In my training courses, I always call it one of the 'dynamite tools': those tools that can really make a difference when it comes down to it.
This time, I am not going to spend time on the simple applications (time plots, run charts) of this chart, but immediately start with the 'Control Chart'. This can also be known under the names SPC chart, control chart, ...
The "Control Chart": "the" ideal tool for quality monitoring and improvement.
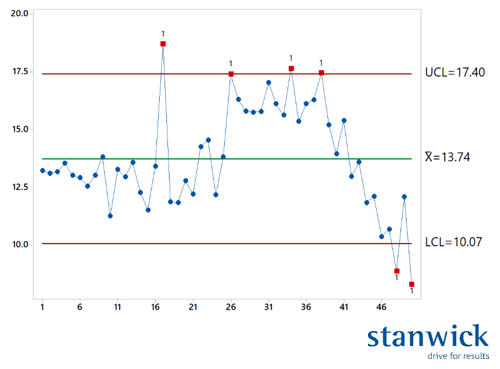
The example shows a limited data set of 50 points. On the graph you can see 3 horizontal lines. The middle line is the average value of these 50 points. The upper and lower lines are the so-called control limits. Control limits are limits that are calculated based on the available data. They have nothing to do with specifications! I have made this example mainly to show the reader the 3 best known and most common forms of 'special cause' variation:
- Special cause' type 1: Outliers. Points that are outside the control limits. In this case there are 6. The good observer will, however, only be able to detect one real outlier, being the first one near the 16th point. The other 5 are most likely part of another kind of 'special cause' variation.
- Special cause' type 2: Shifts. From point 26 approximately, a shift occurs in the process. The average value increases locally from about 13 to about 16.
- Special cause' type 3: Trends. From about point 40 onwards a downward trend starts until the end of the observations.
Companies that are really concerned about the quality they deliver to the customer use this chart on a daily basis as a quality monitoring tool. They also use the different types of 'special cause' variation to continuously improve quality. The only thing you need to do this yourself is a trained team with sufficient process knowledge. Make sure the team is given time to find the real root cause of the problem with each 'special cause'. If, after finding the root cause, you as a company also implement a structural solution that ensures that this root cause never occurs again or only under controlled circumstances, the quality of the delivered products will continue to increase.
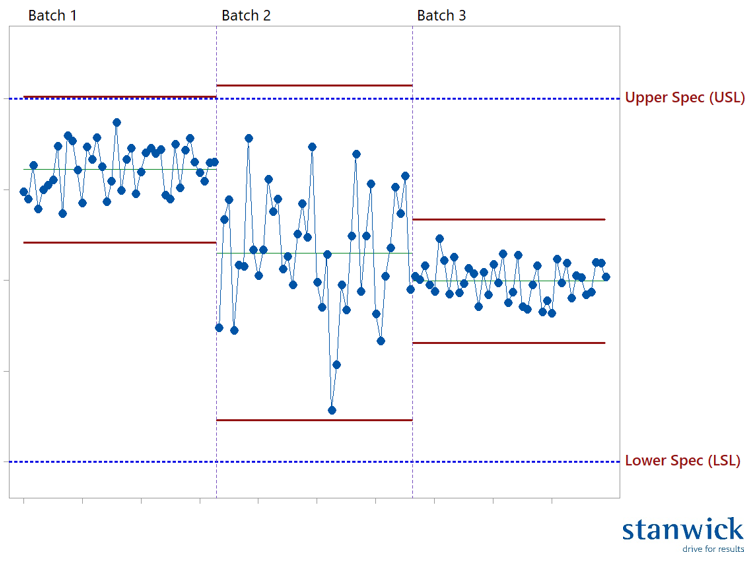
You can also use the Control Chart as a comparison tool. Below you can see the comparison of 3 batches of products. For each chart, the control limits have been calculated and also the customer specifications have been applied to the chart. I let you choose which batch stands out. For the other batches, you can give advice on process modifications to ensure that this problem does not recur in the future.
Een recente anekdote: een groep trainees kwam zelf met het idee om de in-line testen van alle recente batches eens te visualiseren, allemaal op één grafiek en dus overlappend. Tijdens het proces is er volgens sommigen telkens een moment dat de meetfactor uit de band springt. De overlap-grafiek toonde feilloos dat dit bij elke batch op hetzelfde moment gebeurt. We hadden trouwens geluk dat de juiste mensen deelnamen aan deze training. De gezamenlijke kennis van deze mensen leidde direct tot een root-cause analyse en een overzicht van alle gevolgen van dit probleem en een advies voor de organisatie.
Volgende keer probeer ik de zogenaamde ‘process capabilities’ grafiek uit te leggen. Deze is voor velen de meest complexe van alle grafieken. Er bestaat jammer genoeg ook heel veel verwarring rond de gebruikte termen. Hopelijk kan ik het één en ander verduidelijken.
Kurt Maegherman