



Which S&OP KPIs should you monitor?



Which S&OP KPIs should you monitor?
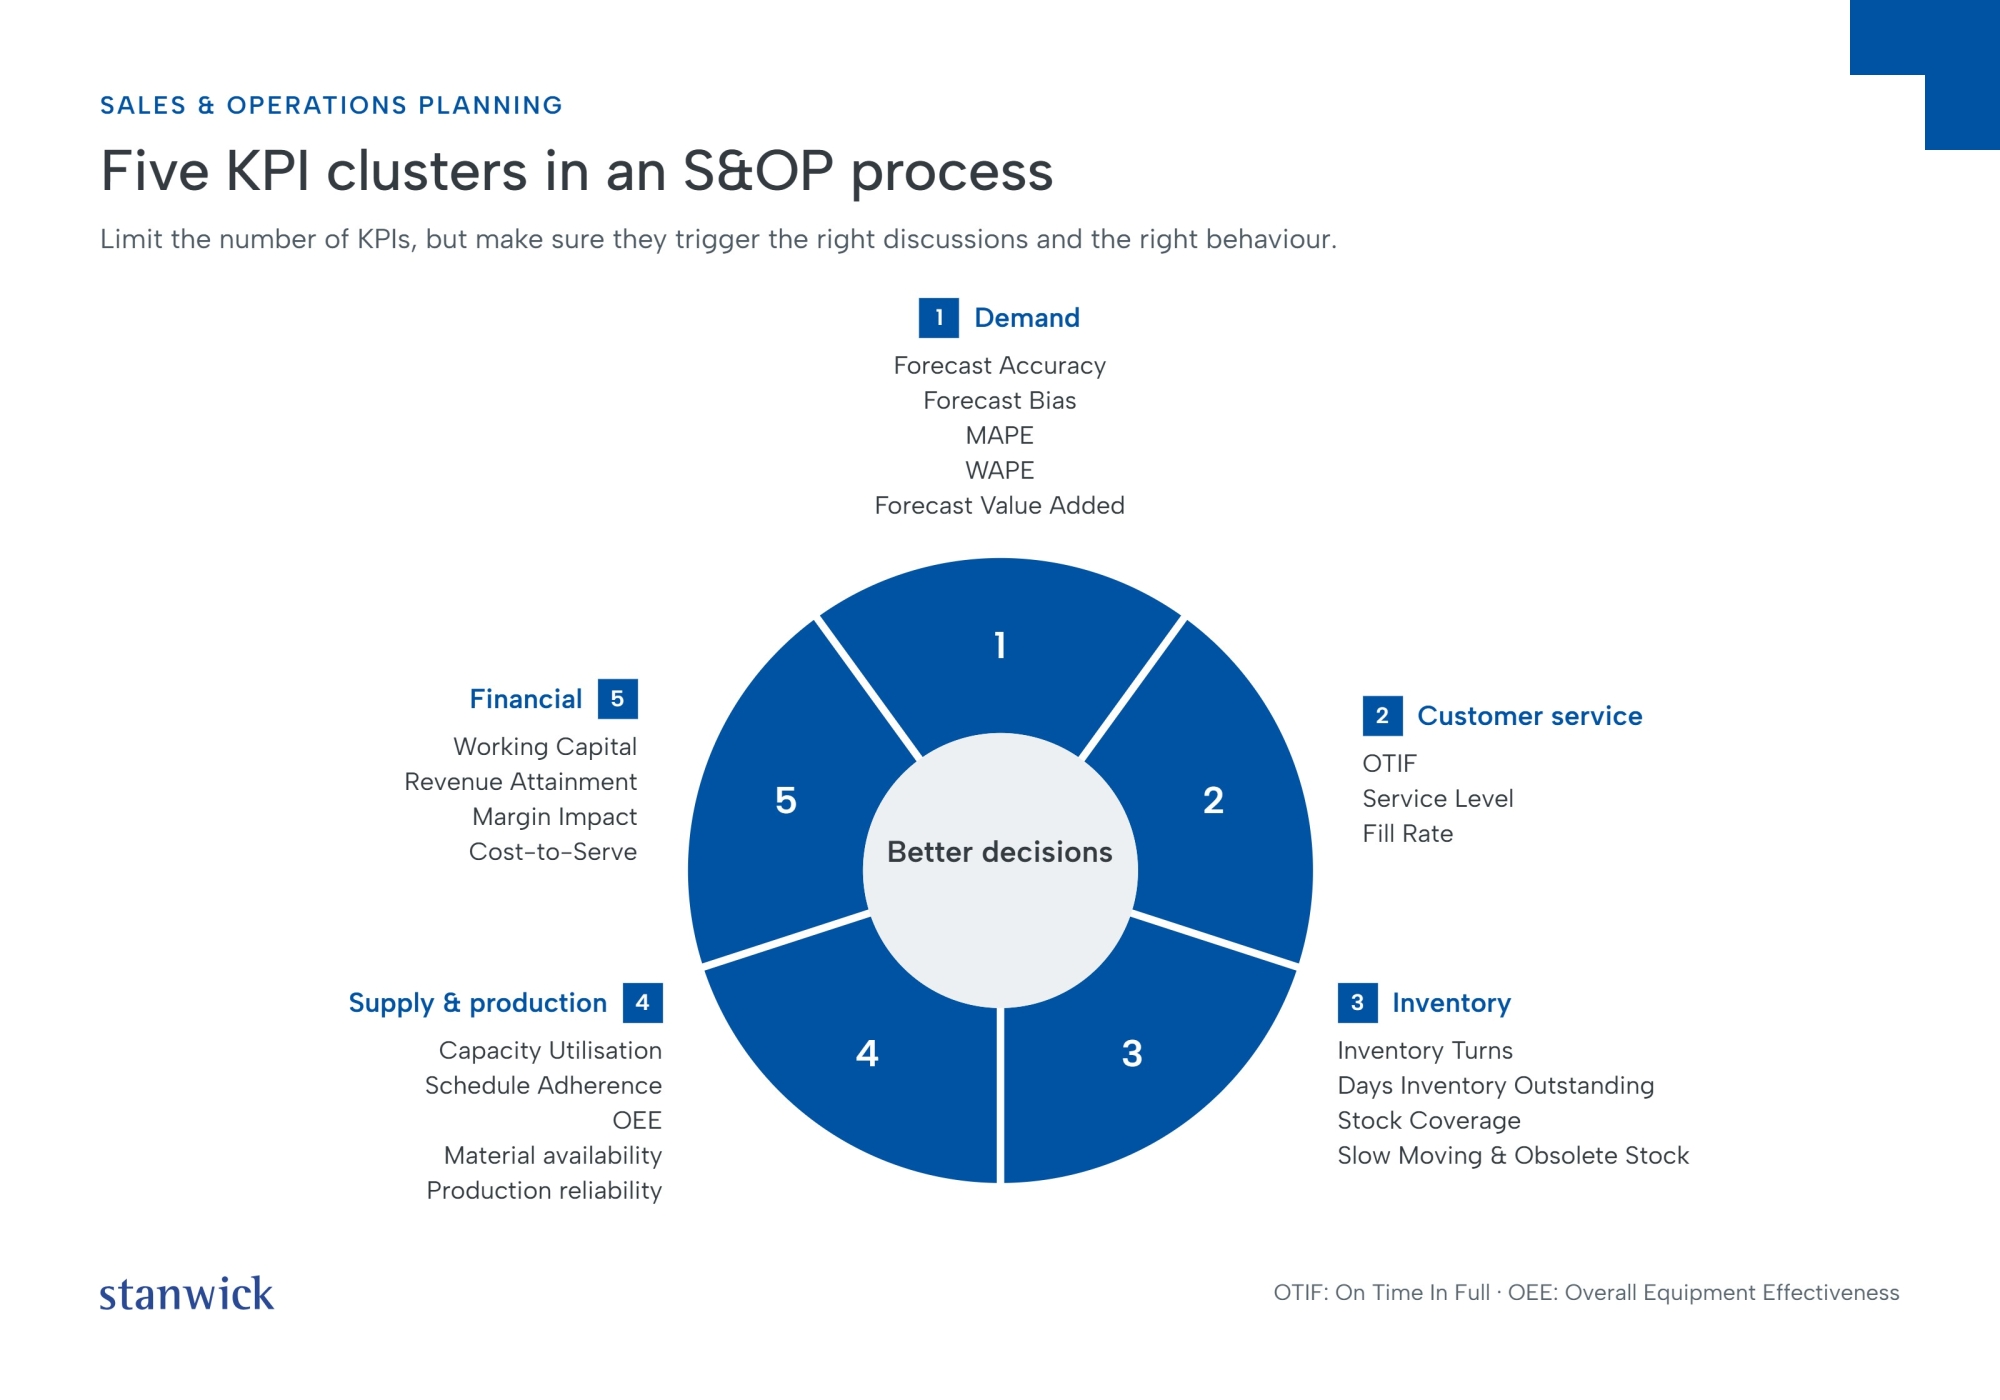
The exact selection depends on the decisions your management needs to make within S&OP. The most important S&OP KPIs fall into five key areas: demand, customer service, inventory, supply and finance. As a minimum, monitor forecast accuracy and bias, OTIF or fill rate, inventory turns or stock coverage, capacity and schedule adherence, and the impact on working capital, turnover and margin.
Which demand KPIs do you use within S&OP?
A reliable forecast is the starting point for a robust S&OP process. Key KPIs include:
- Forecast Accuracy
- Forecast Bias
- MAPE
- WAPE
- Forecast Value Added
Forecast Accuracy, MAPE and WAPE show how significantly the forecast demand deviates from actual demand. MAPE expresses the average error as a percentage, but can give a distorted picture for low-volume products. WAPE takes volume into account and therefore places greater weight on deviations that have a greater impact on the organisation.
Look not only at the magnitude, but also at the direction of the error. Forecast Bias reveals whether your organisation systematically over- or underestimates demand. A persistent overestimation can lead to excess stock, whilst underestimation increases the risk of stock-outs, rush orders and lost revenue.
Forecast Value Added goes one step further. This KPI shows whether adjustments made by, for example, Sales or Marketing actually improve the original forecast. This helps you avoid well-intentioned corrections making the forecast less reliable.
“Forecast Accuracy measures the magnitude of the forecast error; Forecast Bias measures its structural direction.”
Would you like to further professionalise your forecasting process? Discover our forecasting masterclass.
Which customer service KPIs do you use within S&OP?
Ultimately, a good S&OP process must also filter down to the customer. We expect the following essential KPIs:
- OTIF
- Service Level
- Fill Rate
OTIF measures the proportion of orders delivered in full at the agreed time. Fill Rate shows the proportion of customer demand that can be met immediately from available stock. Together, these indicators reveal whether your planning actually leads to higher delivery reliability.
In practice, we often see organisations focusing heavily on reducing stock levels without explicitly monitoring the impact this has on their service. This entails risks. Lower stock levels may seem financially attractive, but can simultaneously lead to more stock-outs, backlogged orders and lost revenue.
S&OP helps to bring this trade-off into focus. Which customers and products take priority in the event of shortages? What stock level is needed to fulfil your customer promise? And at what point does a further reduction in stock no longer outweigh the loss of service?
“OTIF measures whether orders are delivered in full and on time, whilst Fill Rate measures what proportion of demand is immediately available.”
Which stock KPIs do you use within S&OP?
Stock KPIs not only show how much stock you hold, but, more importantly, whether that stock is healthy and aligned with your objectives. Relevant indicators include:
- Inventory Turns
- Days Inventory Outstanding
- Stock Coverage
- Slow-Moving & Obsolete Stock
Inventory Turns indicates how often the average stock is sold or consumed within a given period. Days Inventory Outstanding and Stock Coverage translate stock levels into the number of days or weeks for which products are available. This allows you to quickly identify where too much cash is tied up and where a risk of shortages is emerging.
You should also examine Slow-Moving & Obsolete Stock separately. A stable total stock value can, in fact, mask the fact that an ever-increasing proportion is barely moving or is no longer saleable. The challenge is therefore not simply to hold less stock, but to determine the right stock for the right products and locations.
A robust S&OP cycle makes these choices explicit. What stock is needed to support the desired service level? Which stock can be reduced? And for which obsolete items is a commercial, operational or financial decision required?
“Healthy stock levels combine sufficient availability with limited excess and obsolete stock.”
Which supply and production KPIs do you use within S&OP?
Supply and production KPIs reveal whether your organisation can actually meet the demand plan in practice. Relevant indicators include:
- Capacity Utilisation
- Schedule Adherence
- OEE
- Material Availability
- Production Reliability
Capacity Utilisation shows the extent to which available capacity is being utilised. Schedule Adherence measures whether production orders are being carried out in accordance with the agreed schedule. OEE complements this picture by highlighting losses in terms of availability, performance and quality.
Read more about this KPI in our article on Overall Equipment Effectiveness.
A high capacity utilisation rate is not, in itself, a guarantee of good performance. When materials are missing, machines break down regularly or schedules are constantly changing, an organisation can be very busy yet still end up producing the wrong products too late.
You should therefore always consider these KPIs in conjunction with one another. They help to identify bottlenecks in good time and make informed decisions about extra shifts, alternative suppliers, maintenance, outsourcing or an adjusted product mix. In this way, the Supply Review becomes not a retrospective look at operational problems, but a moment when you look ahead and make targeted adjustments.
“Capacity utilisation shows how much capacity is being used, but Schedule Adherence shows whether the correct production is taking place according to plan.”
Which financial KPIs do you use within S&OP?
A mature S&OP process links operational decisions to their financial impact. Relevant KPIs include:
- Working Capital
- Revenue Attainment
- Margin Impact
- Cost-to-Serve
Working Capital reveals how much cash is tied up in stock. Revenue Attainment shows the extent to which the operational plan supports the targeted turnover. Margin Impact and Cost-to-Serve then help assess whether that turnover is actually profitable.
The latter is important. Additional turnover does not automatically create additional value. Overtime, urgent deliveries, outsourcing, small production runs and complex customer agreements can put significant pressure on the margin.
Finance must therefore not only report figures, but also quantify the consequences of different scenarios. What does extra capacity mean for revenue and margin? What impact does inventory build-up have on working capital? And is a higher service level worth the additional cost? In this way, S&OP helps management to translate operational choices into concrete business decisions.
“Financial S&OP KPIs reveal whether the operational plan is not only feasible but also profitable.”
What mistakes should you avoid when it comes to S&OP KPIs?
Now that we have a better understanding of the KPIs involved in the supply chain decision-making process, we’d like to share a few practical tips on common mistakes made when defining KPIs.
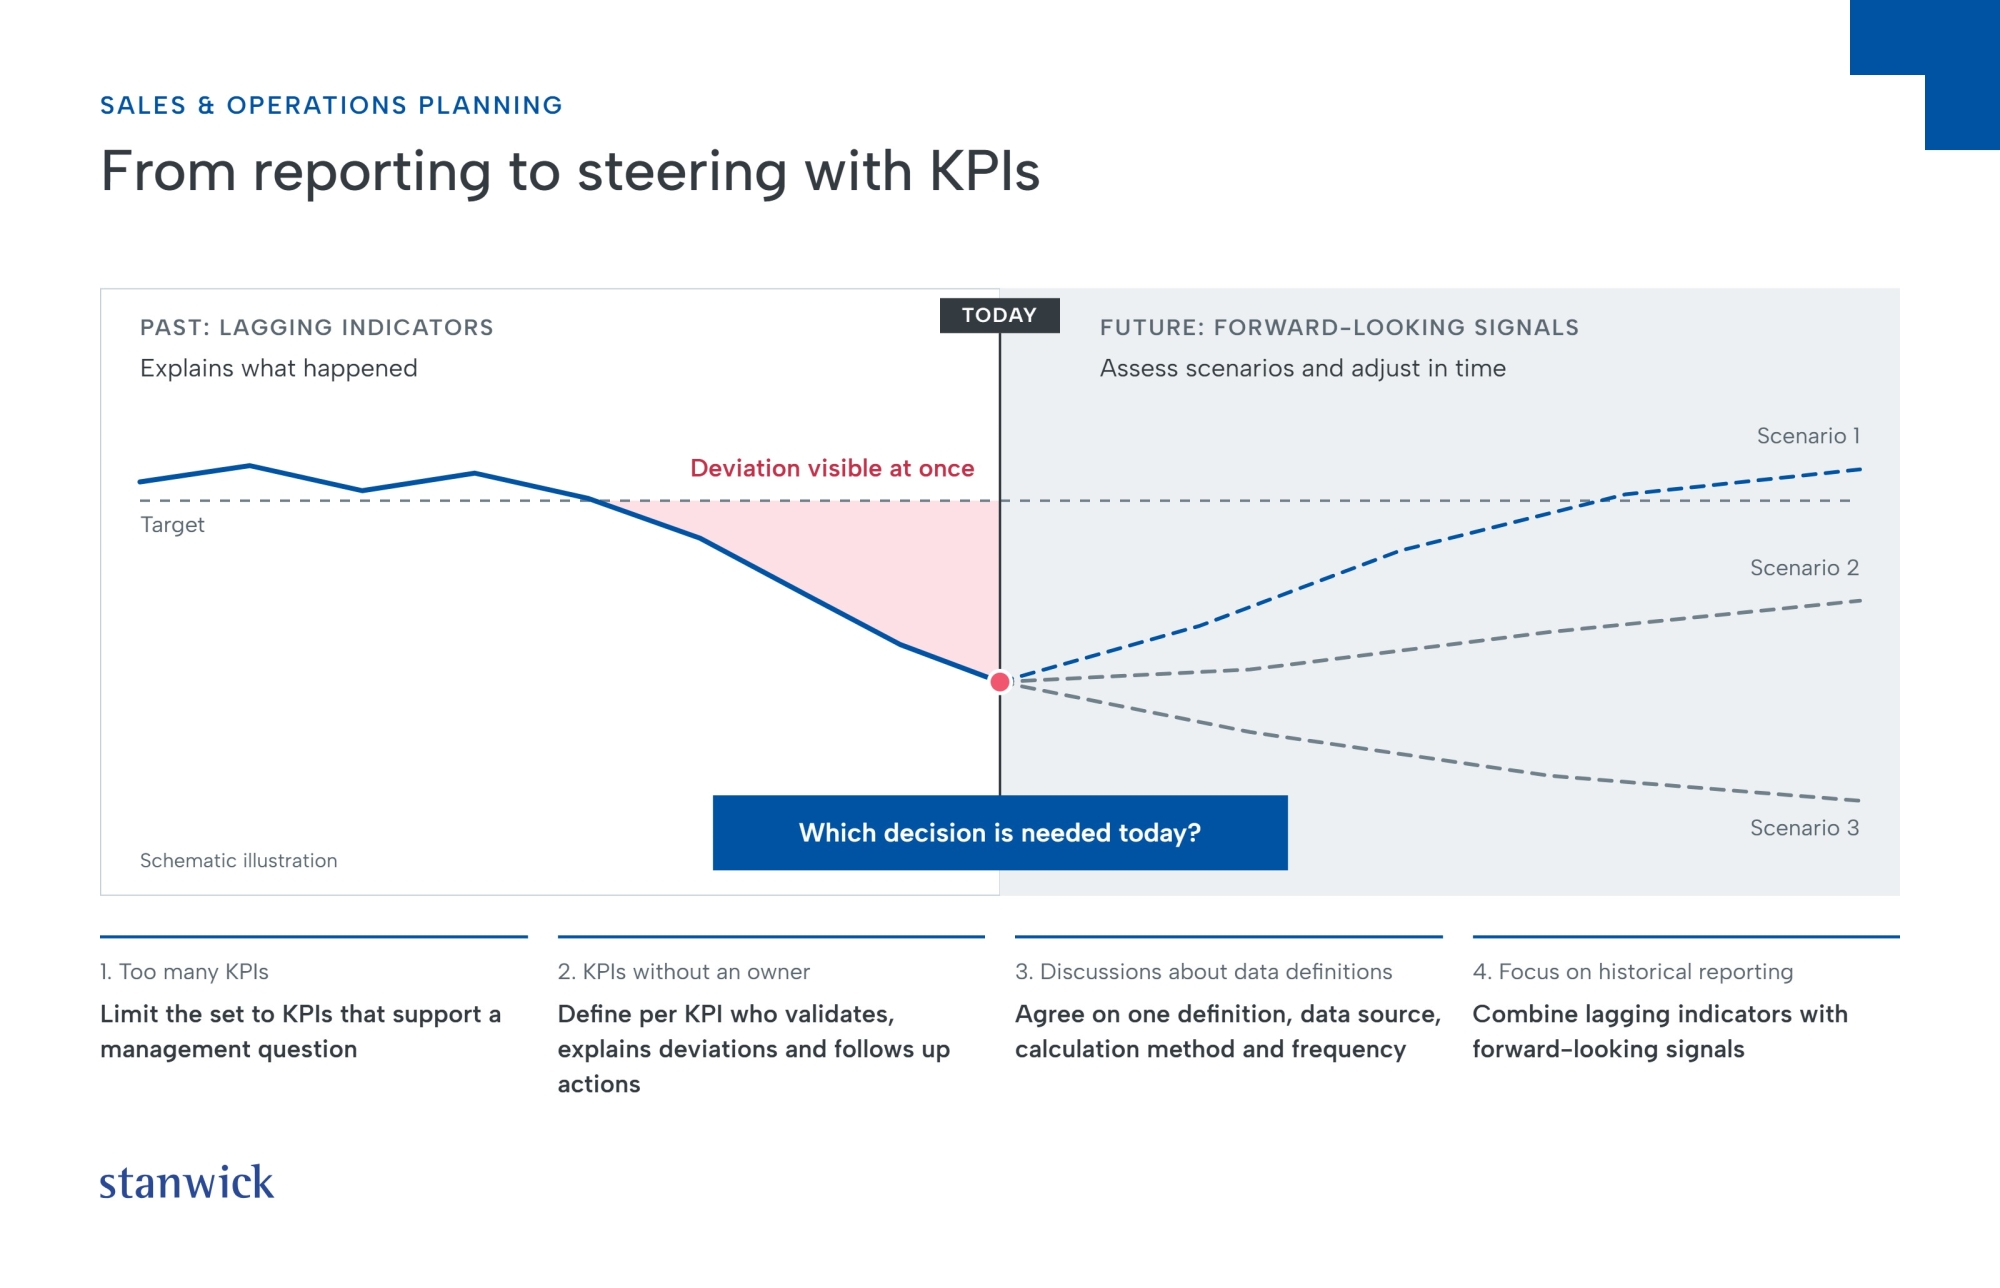
1. Too many KPIs
An S&OP dashboard with too many KPIs distracts from the decisions management needs to make. Limit the set of KPIs to indicators that highlight deviations, risks and specific trade-offs relating to demand, capacity, stock, service and financial impact. Each KPI must support a clear management question; otherwise, it mainly adds to the reporting workload.
2. KPIs without an owner
A KPI without an owner is reported, but rarely actively managed. You should therefore specify for each indicator who validates the data, explains deviations and follows up on improvement actions. Clear KPI ownership strengthens accountability and ensures that figures are translated into actions and decisions more quickly.
3. Discussions about data definitions
When Sales, Operations, Supply Chain and Finance use different definitions, the S&OP meeting shifts from decision-making to debating figures. You should therefore agree on a single definition, data source, calculation method and reporting frequency for each KPI. This creates a single, shared factual basis on which teams can compare scenarios and prepare management decisions.
4. Focus on historical reporting rather than future decisions
Historical KPIs explain what has happened, but do not automatically indicate what decision is needed today. You should therefore combine lagging indicators with forward-looking signals regarding demand, capacity, stock, risks and financial impact. A strong S&OP dashboard helps management not only to understand the past, but above all to assess scenarios and make timely adjustments.
In short, a strong S&OP dashboard does not contain as many KPIs as possible, but exactly enough indicators to make targeted decisions. Combine demand, service, stock, capacity and financial impact. Define a single definition, data source and owner for each KPI. In this way, S&OP becomes not merely a reporting exercise, but a process through which management makes timely adjustments.
Ready to guide your organisation towards better supply chain decisions?
Do you want not only to understand S&OP, but also to apply it successfully within your organisation?
Discover how mature your current decision-making process is and where demand, capacity, stock and financial impact are not yet sufficiently aligned.
Stanwick helps organisations move from siloed planning to integrated decision-making. We support companies with:
- Supply Chain Maturity Assessment
- S&OP and IBP implementation
- Supply Chain Decision Making training and coaching
Book a consultation about your Supply Chain Decision-Making journey or discover Stanwick Academy’s Supply Chain Decision-Making Masterclass.
Further background on our Supply Chain Excellence expertise.
Discover our range of supply chain excellence training courses.
Discover recent supply chain case studies.
Contact us so we can work on solutions together.

Stanwick. Drive for results
Stanwick offers result-oriented coaching programmes on operational excellence, project excellence and supply chain excellence with a focus on people, organisations and processes. We perform thorough assessments, develop clear roadmaps and implement and anchor improvements to guarantee sustainable results.
Our Stanwick Academy organises extensive training courses in which you learn together with a like-minded community about project management, continuous improvement, data-driven organisations, leadership and change management.